
Understanding the Confusion Matrix in Machine Learning: A Comprehensive Guide
Table of Contents
- What is a Confusion Matrix?
- Key Components Explained
- Importance of Confusion Matrix in Model Evaluation
- Choosing the Right Model Based on Error Types
- Multi-Class Confusion Matrix
- Visualizing the Confusion Matrix with Scikit-learn
- Advantages of Using Confusion Matrix
- Potential Pitfalls
- Best Practices
- Conclusion
What is a Confusion Matrix?
A Confusion Matrix is a tabular representation that allows you to visualize the performance of a classification algorithm. By comparing the predicted results with the actual outcomes, it provides a clear insight into the types of errors made by the model. This matrix is especially useful in binary and multiclass classification problems.
Structure of the Confusion Matrix
For a binary classification problem, the confusion matrix is a 2×2 table, whereas for multiclass classification, it expands to an NxN matrix, where N represents the number of classes.
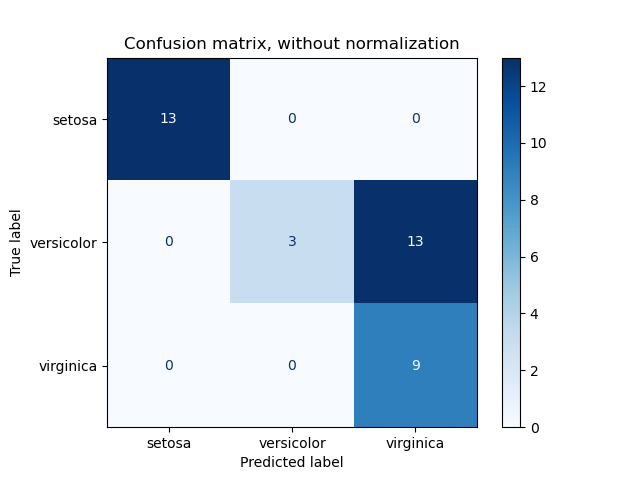
Image Source: Scikit-learn Confusion Matrix Example
The matrix comprises the following components:
| Predicted Positive (P) | Predicted Negative (N) | |
|---|---|---|
| Actual Positive (P) | True Positive (TP) | False Negative (FN) |
| Actual Negative (N) | False Positive (FP) | True Negative (TN) |
Key Components Explained
True Positive (TP)
- Definition: The model correctly predicts the positive class.
- Example: Predicting that an email is spam, and it is indeed spam.
True Negative (TN)
- Definition: The model correctly predicts the negative class.
- Example: Predicting that an email is not spam, and it is indeed not spam.
False Positive (FP) – Type I Error
- Definition: The model incorrectly predicts the positive class.
- Also Known As: Type I Error.
- Example: Predicting that an email is spam, but it is actually not spam.
- Implications: Depending on the context, Type I errors can be less critical, such as erroneously flagging a legitimate email as spam.
False Negative (FN) – Type II Error
- Definition: The model incorrectly predicts the negative class.
- Also Known As: Type II Error.
- Example: Predicting that an email is not spam, but it is actually spam.
- Implications: In critical applications like medical diagnostics, Type II errors can be dangerous, such as failing to detect cancer when it is present.
Importance of Confusion Matrix in Model Evaluation
The confusion matrix serves as the foundation for several evaluation metrics, including:
- Accuracy: (TP + TN) / (TP + TN + FP + FN)
- Precision: TP / (TP + FP)
- Recall (Sensitivity): TP / (TP + FN)
- F1 Score: 2 * (Precision * Recall) / (Precision + Recall)
These metrics provide a nuanced understanding of the model’s performance beyond mere accuracy, especially in scenarios where data is imbalanced.
Choosing the Right Model Based on Error Types
Different applications emphasize minimizing different types of errors:
- Medical Diagnostics: Prioritize reducing Type II errors to ensure conditions like cancer are not missed.
- Spam Detection: Minimizing Type I errors can prevent legitimate emails from being marked as spam unnecessarily.
For instance, models like Support Vector Machines (SVM) are preferred when reducing Type II errors is crucial, whereas XGBoost may be chosen for scenarios where Type I errors are more critical.
Multi-Class Confusion Matrix
While binary classification is straightforward, multiclass classification introduces complexity. In such cases, the confusion matrix expands to accommodate all classes, with each row representing the actual class and each column representing the predicted class.
Example with Iris Dataset
Consider the Iris dataset, which includes three classes: Setosa, Versicolor, and Virginica. The confusion matrix for a multiclass classification model might look like this:
| Setosa | Versicolor | Virginica | |
|---|---|---|---|
| Setosa | 12 | 0 | 0 |
| Versicolor | 1 | 10 | 1 |
| Virginica | 0 | 2 | 12 |
This matrix indicates the number of correct and incorrect predictions for each class, facilitating a detailed performance assessment.
Visualizing the Confusion Matrix with Scikit-learn
Python’s Scikit-learn library offers built-in functions to plot and analyze confusion matrices, enhancing interpretability.
Sample Code to Plot Confusion Matrix
|
1 2 3 4 5 6 7 8 9 10 11 12 13 14 15 16 17 18 19 20 21 |
from sklearn.metrics import confusion_matrix, plot_confusion_matrix import matplotlib.pyplot as plt from sklearn.model_selection import train_test_split from sklearn.svm import SVC from sklearn.datasets import load_iris # Load dataset iris = load_iris() X = iris.data y = iris.target # Split into train and test X_train, X_test, y_train, y_test = train_test_split(X, y, random_state=0) # Initialize and train the model model = SVC(kernel='linear', C=0.01).fit(X_train, y_train) # Plot confusion matrix plot_confusion_matrix(model, X_test, y_test, display_labels=iris.target_names, cmap=plt.cm.Blues, normalize='true') plt.title('Confusion Matrix - Iris Dataset') plt.show() |
This code snippet trains an SVM model on the Iris dataset and visualizes the normalized confusion matrix, providing clear insights into the model’s performance across different classes.
Advantages of Using Confusion Matrix
- Detailed Error Analysis: Identifies specific types of errors, facilitating targeted improvements.
- Model Comparison: Enables comparison between different models based on their error profiles.
- Handling Imbalanced Data: Provides clarity on how models perform across various classes, especially in imbalanced datasets.
Potential Pitfalls
- Complexity with Many Classes: As the number of classes increases, the confusion matrix can become large and harder to interpret.
- Misleading Accuracy: In imbalanced datasets, high accuracy can be deceptive. The confusion matrix helps uncover performance issues that accuracy alone might mask.
Best Practices
- Normalize the Matrix: Especially useful in multiclass scenarios to understand the proportion of correct and incorrect predictions.
- Combine with Other Metrics: Use alongside precision, recall, and F1 score for a holistic evaluation.
- Visual Representation: Utilize color gradients to make patterns in the matrix more discernible.
Conclusion
The confusion matrix is an indispensable tool in the machine learning toolkit, offering a window into the internal workings of classification models. By understanding its components and leveraging its insights, data scientists can make informed decisions to enhance model performance, select appropriate algorithms, and mitigate critical errors. As machine learning continues to evolve, mastering the confusion matrix will remain a cornerstone of effective model evaluation and deployment.
Further Reading:
Stay Updated:
For more insights into machine learning evaluation techniques, subscribe to our newsletter and follow our blog updates.